A Tale of Two Wainos

Background
Can small, seemingly irrelevant discrepancies between pitches be the difference that causes a pitcher to have a great outing instead of a poor one?
Adam Wainwright was once one of the most dominant pitchers in the game of baseball. In 2016, however, Waino seemed unable to return to his former dominant self after suffering a season-ending achilles tear in 2015. I’m going to compare two of Wainright’s starts this season – one dominant outing and one poor outing – and analyze what caused Adam’s success in the former and failure in the latter. What I’m not going to do is look too hard for things like mechanical differences in Wainwright’s delivery. The purpose of this analysis isn’t to figure out “what’s wrong with Wainwright”, but rather to emperically look at the differences in the pitches.
The Games
I chose to compare Wainwright’s outings on May 12 and July 16. On May 12, Wainwright pitched 5 innings giving up 11 hits and 7 runs to the Angels lineup. The St. Louis Post Dispatch commented, “The start was not what the Cardinals or Adam Wainwright desired.”1 It really wasn’t all that unusual though. Wainwright really struggled at the beggining of the season and by June he had posted an ERA of 5.71.2 Throughout June and July Wainwright put up pretty good numbers before a mediocre end of the season.
July 16 was in the middle of Wainwright being “on his game” this season. It was his best start of the year. He had a complete game 3-hitter shutout. He really looked like the dominant Wainwright of the past. The Marlins lineup was just not at all able to read his pitches.
What made the Adam Wainwright of July 16 so dominant while the Wainwright of May 12 was simply ineffective? Well, in the words of Cardinals Manager Mike Matheny, “The art of tonight was him taking off a little bit of velocity, putting on a little movement, and all, all about location.”3 Let’s directly compare the numbers and see how much of what Matheny said was right.
Methodology
MLB Advanced Media has a system installed in every ballpark called PITCHf/x. Using mounted cameras and advanced algorithms, they track things like the release point, release velocity, spin rate, spin direction, break, pitch type, and more for every pitch in the MLB. The great thing is they actually release all of this data in XML on their website, free for public use. It provides people everywhere with the data they need to perform statistical analysis of baseball.
I downloaded the XML list of all pitches for each game. I then wrote two separate python scripts. One parses any given type of pitch from the XML and creates a spray plot of the locations color coded by the outcome. The second script parses any given type of pitch and outputs some statistics on the pitch like how often it’s thrown, velocity, and break.
Both scripts also attempt to correct for error in pitch classifications since the data seemed to have many fastballs and sinkers incorrectly classified as cutters.
Both scripts, their output figures and stats, and the input XML data are all available on my github.
Velocity and Movement
First, let’s look at some stats side-to-side for Adam Wainwright’s sinkers.
_______________________________________________________________________________
| Sinkers -- 7/16/16                   | Sinkers -- 5/12/16                   |
|--------------------------------------|--------------------------------------|
| 26 thrown, 21.666667% of all pitches | 28 thrown, 32.558140% of all pitches |
| Velocity:                            | Velocity:                            |
|     Mean:         89.373077          |     Mean:         90.328571          |
|     Std. Dev:     1.946310           |     Std. Dev:     1.476206           |
| Break Length:                        | Break Length:                        |
|     Mean:         6.403846           |     Mean:         5.550000           |
|     Std. Dev:     0.563970           |     Std. Dev:     0.849159           |
| Break Angle:                         | Break Angle:                         |
|     Mean:         29.800000          |     Mean:         32.017857          |
|     Std. Dev:     5.394442           |     Std. Dev:     3.201680           |
|______________________________________|______________________________________|
We don’t see too much of a difference there. During the bad start, Adam averaged about 1mph faster and he had a bit more lateral movement while sacrificing a bit of break. I don’t think there’s anything too significant between the two.
Next, let’s look at four-seam fastballs.
_______________________________________________________________________________
| Four-seam Fastballs -- 7/16/16       | Four-seam Fastballs -- 5/12/16       |
|--------------------------------------|--------------------------------------|
| 30 thrown, 25.000000% of all pitches | 8 thrown, 9.302326% of all pitches   |
| Velocity:                            | Velocity:                            |
|     Mean:         88.873333          |     Mean:         89.562500          |
|     Std. Dev:     1.777439           |     Std. Dev:     1.052304           |
| Break Length:                        | Break Length:                        |
|     Mean:         5.013333           |     Mean:         4.925000           |
|     Std. Dev:     0.494458           |     Std. Dev:     0.519013           |
| Break Angle:                         | Break Angle:                         |
|     Mean:         17.900000          |     Mean:         23.150000          |
|     Std. Dev:     4.378736           |     Std. Dev:     4.983473           |
|______________________________________|______________________________________|
Again, I don’t think anything is too different here. The break angle is once again a bit more lateral during the bad start, but other than that, everything is nearly identical.
_______________________________________________________________________________
| Curveballs -- 7/16/16                | Curveballs -- 5/12/16                |
|--------------------------------------|--------------------------------------|
| 20 thrown, 16.666667% of all pitches | 18 thrown, 20.930233% of all pitches |
| Velocity:                            | Velocity:                            |
|     Mean:         73.085000          |     Mean:         73.750000          |
|     Std. Dev:     1.870100           |     Std. Dev:     0.980504           |
| Break Length:                        | Break Length:                        |
|     Mean:         15.550000          |     Mean:         15.433333          |
|     Std. Dev:     0.640703           |     Std. Dev:     0.447214           |
| Break Angle:                         | Break Angle:                         |
|     Mean:         -12.775000         |     Mean:         -15.066667         |
|     Std. Dev:     1.694956           |     Std. Dev:     1.598263           |
|______________________________________|______________________________________|
Once again, with the curveballs there’s nothing too different besides the break angle, which is still more lateral.
_______________________________________________________________________________
| Cutters -- 7/16/16                   | Cutters -- 5/12/16                   |
|--------------------------------------|--------------------------------------|
| 42 thrown, 35.000000% of all pitches | 31 thrown, 36.046512% of all pitches |
| Velocity:                            | Velocity:                            |
|     Mean:         83.450000          |     Mean:         86.287097          |
|     Std. Dev:     2.195260           |     Std. Dev:     1.051187           |
| Break Length:                        | Break Length:                        |
|     Mean:         8.002381           |     Mean:         6.290323           |
|     Std. Dev:     0.746576           |     Std. Dev:     0.878178           |
| Break Angle:                         | Break Angle:                         |
|     Mean:         -7.369048          |     Mean:         -13.816129         |
|     Std. Dev:     2.335593           |     Std. Dev:     2.863688           |
|______________________________________|______________________________________|
I think the cutter is the pitch Mike was talking about. The velocity is down a full 3mph in the good start versus the bad start, but the pitch had dramatically more movement. Also, the movement was almost twice as downward versus the cutters of Adam’s bad start.
I think it’s apparent that during his dominant start on July 16, Wainwright threw with a higher arm slot than he did during his bad start on May 12. The result was less lateral movement but more aggressive downward movement for the cutter, sinker, and curveball. Also, as Mike Matheny said, Wainwright sacrificed a bit of velocity in exchange for more movement – especially on his cutter which almost looked more like a slider.
Location
For each game, I created plots of the locations of the four most common pitches in Wainwright’s repertoire, the sinker, the cutter, the fastball, and the curveball. The strike zone shown is the average strike zone for all of the players on the opposing team that game (it turns out the Angels lineup was a bit shorter than the Marlins). Pitches that were balls are colored blue. Any good outcome for a pitch (called strike, swinging strike, foul, non-RBI in-play out) is highlighted red. Any bad outcome for a pitch (the player got a hit or runs scored) is highlighted black. Note this highlighting scheme may be a bit too generous to the pitcher: a 350ft flyout probably has more to do with good luck than good pitching, for example. Also, note that even though walks are a bad thing, I am simply highlighting them in the ball color, blue, so it’s easier to see exactly which pitches batters hit.
First, let’s look at Wainwright’s most thrown pitch: the sinker. The first graph is of the locations during his bad outing and the second is during his good outing.
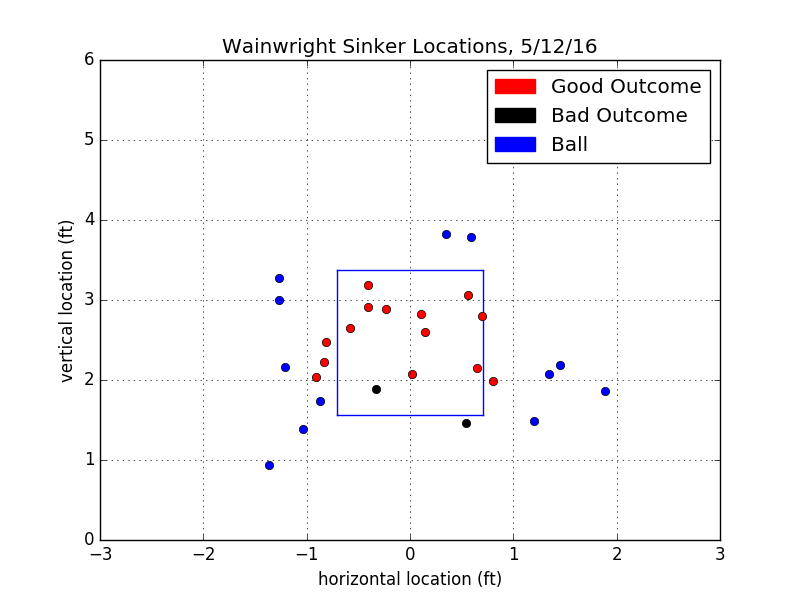
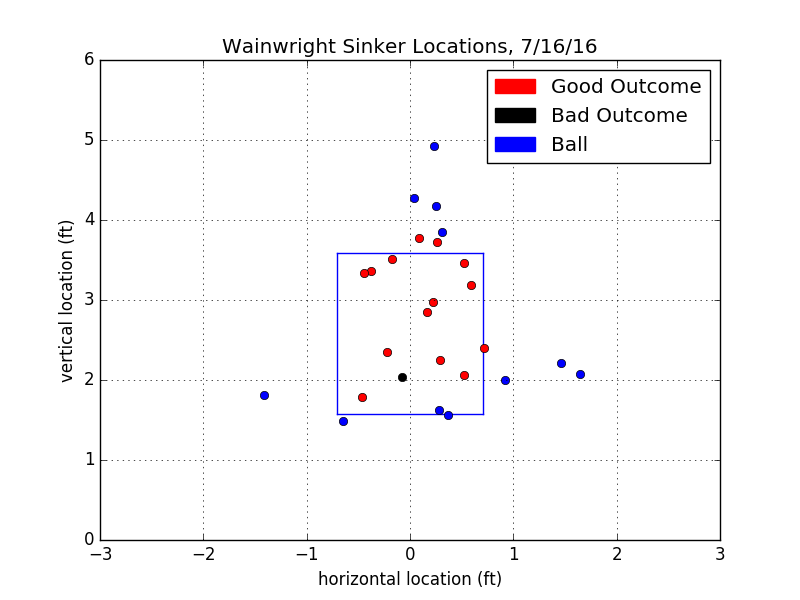
At first glance, the location of the sinker really doesn’t look any better in Adam’s good start. If anything, it’s worse since there’s more around the top of the strike zone. This starts to make a little more sense when we look at Wainwright’s four-seam fastballs.
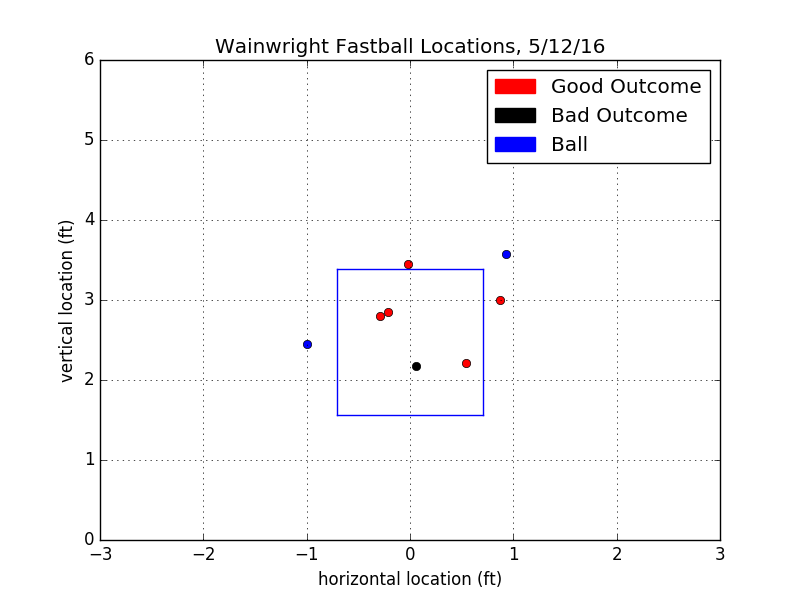
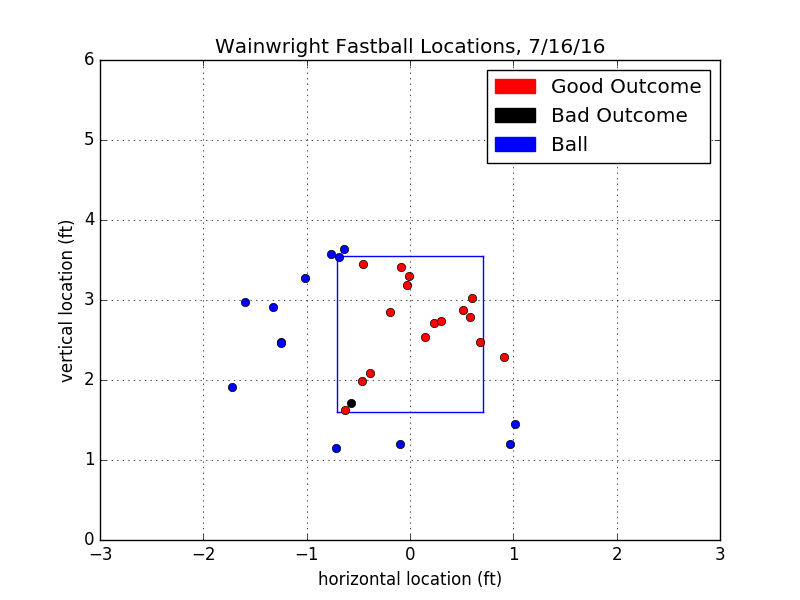
As you can see, during the good start, Waino threw a lot more fastballs. The proportion of four-seamers thrown on July 16 was 25.0%; on May 12 it was only 9.3%! Sinkers are really also fastballs. They’re a different type of fastball, sometimes called a two-seam fastball. Normal fastballs, four-seam fastballs, are given their name because all four seams of the baseball cut the air. This gives the ball more lift and makes the ball not drop off at the end. Some really good four-seam fastballs may even appear to the batter to rise a bit during their flight. Sinkers are thrown so that not all four seams cut the air. They will initially look like a normal fastball, but because they have less lift, they will drop off towards the end of their trajectory. This tends to induce a lot of ground balls.
Although Adam Wainwright varies him arm slots some, he tends to throw from mostly a 3/4 arm slot. From that arm slot (and most others), four-seam fastballs and sinkers both will break inside a bit. From the batter’s point of view, the two pitches may appear very similar until the last split-second. At that point, a four-seam fastball will stay level while a sinker will drop off because the seams cutting the air provide much less lift. In other words, by throwing more fastballs, Wainwright’s sinker is more effective, even though the location isn’t any better. When batters see more four-seam fastballs, they swing on top of the sinkers and groundout because they cannot adjust to the drop-off of the sinker without often swinging under a four-seam fastball.
Now let’s have a look at the curveballs.
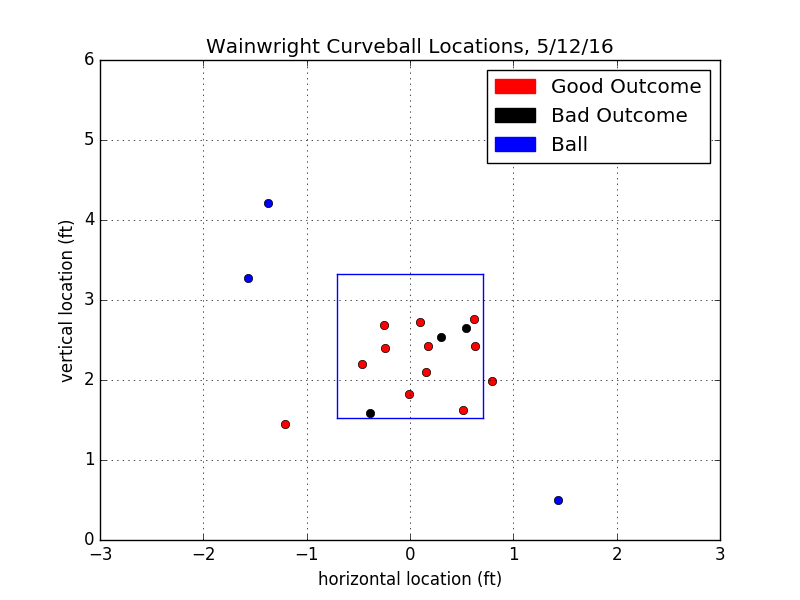
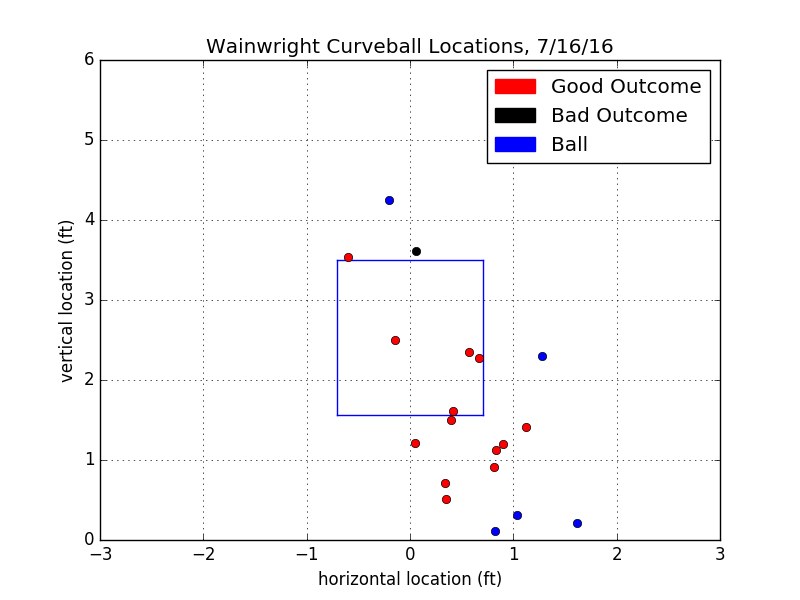 Wainwright is known for having a devasting curveball. It’s consistently been
one of his best pitches and he’s even had outings where he relied heavily on it
when his fastball command was off. The difference between the locations of Adam’s
curveballs in the good versus the bad start is very pronounced. In the good start,
almost all of the curveballs are low and away, out of the strike zone. These are the
types of pitches that a batter not looking for a curveball would be made to
look stupid by. He would see a ball traveling straight, think fastball and
start swinging, only to realize too late that the ball is taking a noze dive out of the
strike zone and that his bat is going to miss by about two feet.
During the bad start, most of Wainwright’s curveballs were in the strikezone. The strikezone, is a dangerous place for curveballs to be – leave one hanging to a batter who guesses you’re going to throw it and they’ll probably hit it about a million feet. Wainwright probably would have fared quite a bit better May 12 had he been able to keep the curveball low.
Finally, let’s compare Wainwright’s cutter locations for the bad outing versus the good
outing.
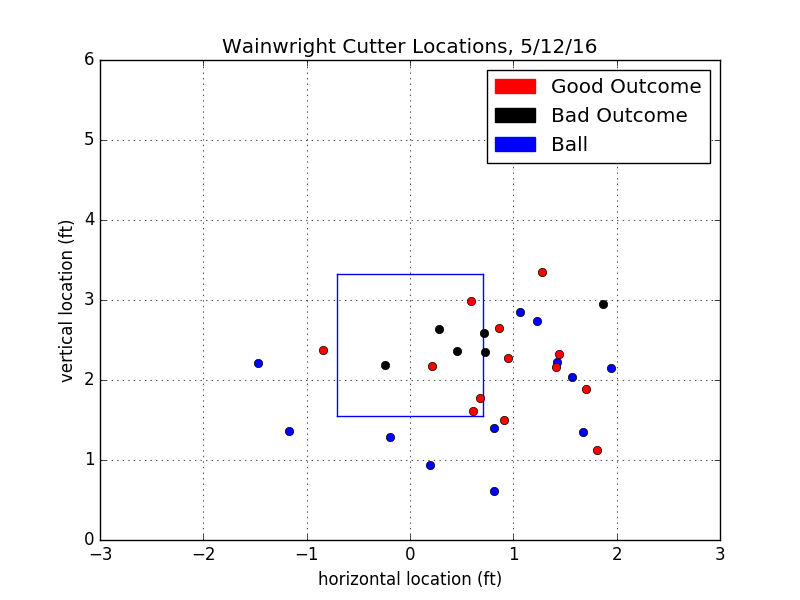
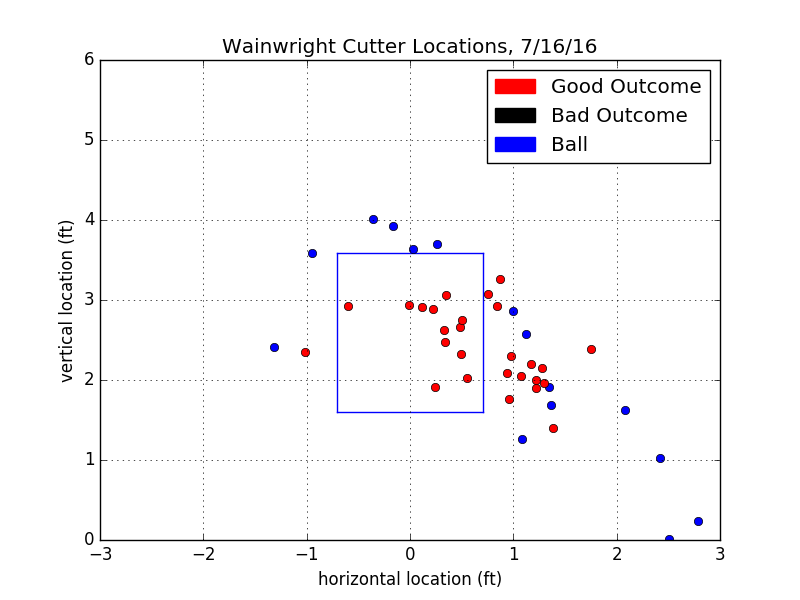 As you can see, for the good outing, there is a cluster of pitches low and
away, which is probably what Yadi called for most of the time.
For the bad outing, more pitches seem to be up and away or just
plain low. Too low, and a batter might tell that the pitch is going to be
a ball and not swing. Too high and the batter could step in, reach out, and
make strong contact. Certainly, if you look at a few of the bad outcome pitch
locations, you can see that there are pitches in similar locations on the
good outing, so maybe Wainwright got lucky a few times. Still, most of his
cutters have much better location. These graphs really exemplify how small
differences in pitch location can make the difference in whether a cutter
gets smacked the other way for a double, or whether results in a whiff
strike three.
Without good command of his pitches, especially the softer ones like the curveball and cutter, batters were very much able to make strong contact off Wainwright.
When Waino places his cutter in the right spot, it should look something like this.

Conclusion
There’s quite a few differences that are noticable between the dominant Wainwright of July 16 and the ineffective Wainwright of May 12. As Matheny noted, the dominant Wainwright sacrificed some velocity for movement. Also, he threw with a more overhead arm slot which resulted in less lateral movement and more vertical movement. Wainwright threw far more four-seam fastballs which, in turn, made his sinker a more effective pitch. He also had better command of his pitches, especially the curveball.
Of the four things named, three of them are a result of pitching “choices” rather than simply being “on your game.” Perhaps now that Wainwright has turned 35, he should try to beat the batter with movement instead of velocity. It certainly seemed to work on July 16. Also, throwing more fastballs seems to make Wainwright’s sinker do better against batters, even if it’s not placed perfectly. Finally, Wainwright seems to have better luck from an arm slot closer to overhead versus 3/4.
The sample size here is small. It’s just one game being compared to another. But it shows that Wainwright can still be one of the most dominant pitchers in the game of baseball. It illustrates that the differences between a great start and a poor start are more than just luck. 2017 is almost here. As a lifelong Cardinals fan, let’s hope Waino proves to be his July 16 self throughout next season.
References
-
Cards Muscle up for Sweep of Angels. St. Louis Post Dispatch. May 13, 2016. ↩
-
Adam Wainwright, 2016 Gamelog. Baseball-Reference.com. ↩
-
Wainwright throws 3-hitter, Cardinals blank Marlins 5-0. Fox2Now St. Louis. July 16, 2016. ↩